Remote Debugging WSO2 products using Intellij idea IDE

Are you trying to understand the WSO2 products’ code base? Or encounter with an error while executing a carbon component? Plus don’t know about “REMOTE DEBUG”?🤔
Go through this blog post ……. You would solve your problems with “REMOTE DEBUG”
This will help you to remote debug any WSO2 product for sure 🙂
I will use WSO2 Identity server as the example.
(1) Download WSO2 identity server zip and unzip it. (Hereafter that folder is referred as <PRODUCT_HOME>)
You can download latest WSO2 IS from here
(2)Go to <PRODUCT_HOME>/bin/ folder and start the WSO2 product as follow.
In Linux Environment
sh wso2server.sh -debug 5005
In Windows Environment
wso2server.bat -debug 5005
Then your terminal looks like this.

Here, the remote server waits till you start debug client due to the following configuration.
Go to<PRODUCT_HOME>/bin/wso2server.sh , and search forword suspend (Press Ctrl+F and find the word suspend)

It is found in line 173 according to my screen shot.. The remote server waits till you start debug client if suspend=y .. In IS all the authenticators bind at the server startup. If you need to debug anything on the startup, enabling suspend is the way.
If you don’t need the remote server to wait until you start debug client, change the suspend attribute as suspend=n .
(3)Open wso2 product’s code base/carbon component project using IntelliJ IDEA (If you don’t have that IDE, find it from here). Here, I use carbon-identity-framework as the code base.
(4) Go to Run->Debug in IntelliJ. It will give a dialog box and click on Edit Configurations
OR instead ;
Click button Add Configuration in the toolbar.

Then you will get the following Run/Debug Configuration dialog box.
(5) Press + sign on upper left corner and select Remote .
(6) Then give a name such as I have given(Remote-debugger) and press OK. Make sure that Host: localhost and Port:5005 have been set.
(7) Add break points to the required lines by simply clicking near the line number.
(8) Go Run->Debug ‘<The given name>' (Run->Debug ‘Remote-debugger’ in my case) OR press Shift+F9 .
(9) When the server boots up successfully, you can function with the activity you want to debug.
(10) When you are done with one breakpoint, resume the program by using the resume icon in the debugger panel or pressing F9.
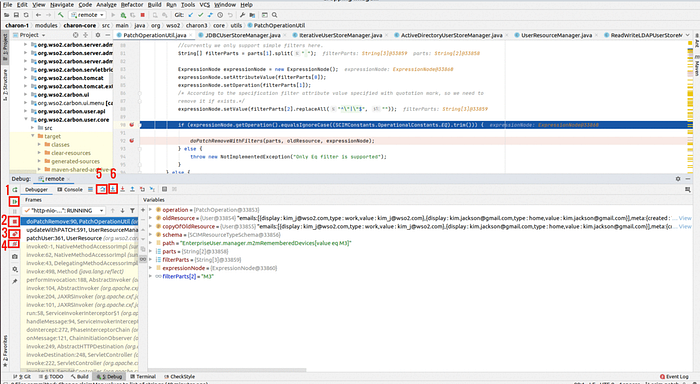
1- Resume program (F9) — You will go to the next break point
2- Stop remote debug (Ctrl+F2)
3- View Breakpoints (Ctrl+Shift+F8)
4- Disable breakpoints — If you don’t want to stop at any breakpoints press (4) and then (1)
5- Step over (F8) — Go to the next line in the code
6- Step Into (F7) — Go deep into the function of the current breakpoint
Yeah !!! We are done 🤗
But WAIT !!!
If you want to know how to remotely debug multiple repositories at once you have to read the next section as well.
Want to know how to debug multiple repositories??
You may want to debug two or more repositories at a time. Then what should you do?? The easiest way is to add both repositories into one IDE as modules and debug as usual.
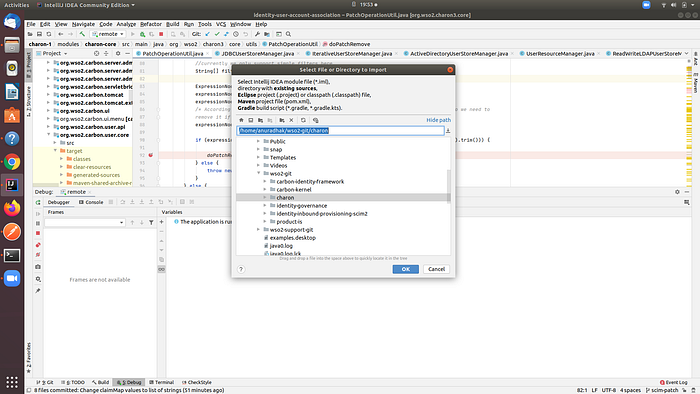
(1) Navigate to File -> New -> Module from Existing Sources.
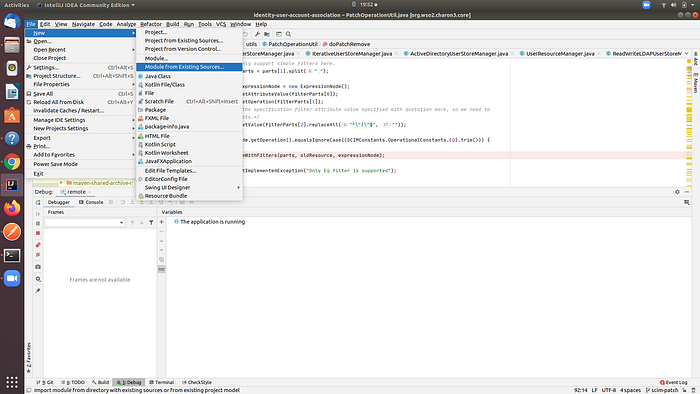
(2) Then a dialog box named Select File or Directory to Import is prompted. You have to select the repository and press ok.
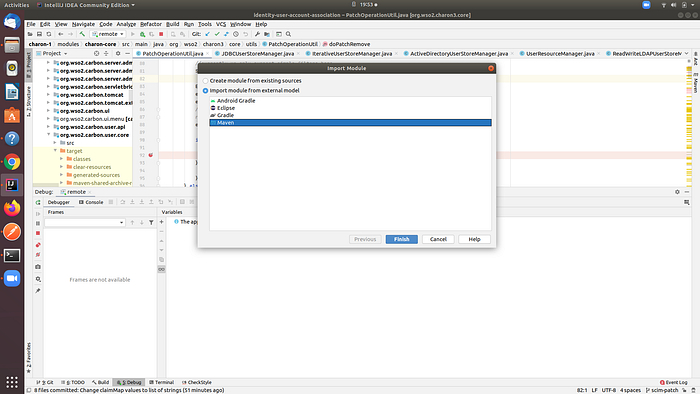
(3) Next, select the radio button “Import module from external model” and select Maven for WSO2 repositories. (Select appropriate one according to your repo). Then click on Finish.
Following the above method, you can add multiple repositories to one IDE and proceed with remote debugging.
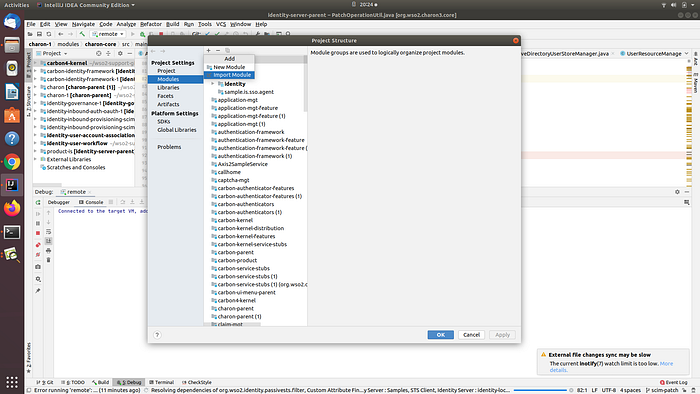
- Instead of the above steps, you can navigate to File -> Project Structure
- Select Modules under Project Settings.
- Click on + sign on the middle panel and click on Import module
Happy coding!!
